Time-Series Forecasting Use Cases That Actually Pay for Themselves
 Timestral Team
Six practical forecasting use cases — demand, staffing, energy, SaaS traffic, manufacturing and finance — with the data you need, the decision you make and the metric to watch.
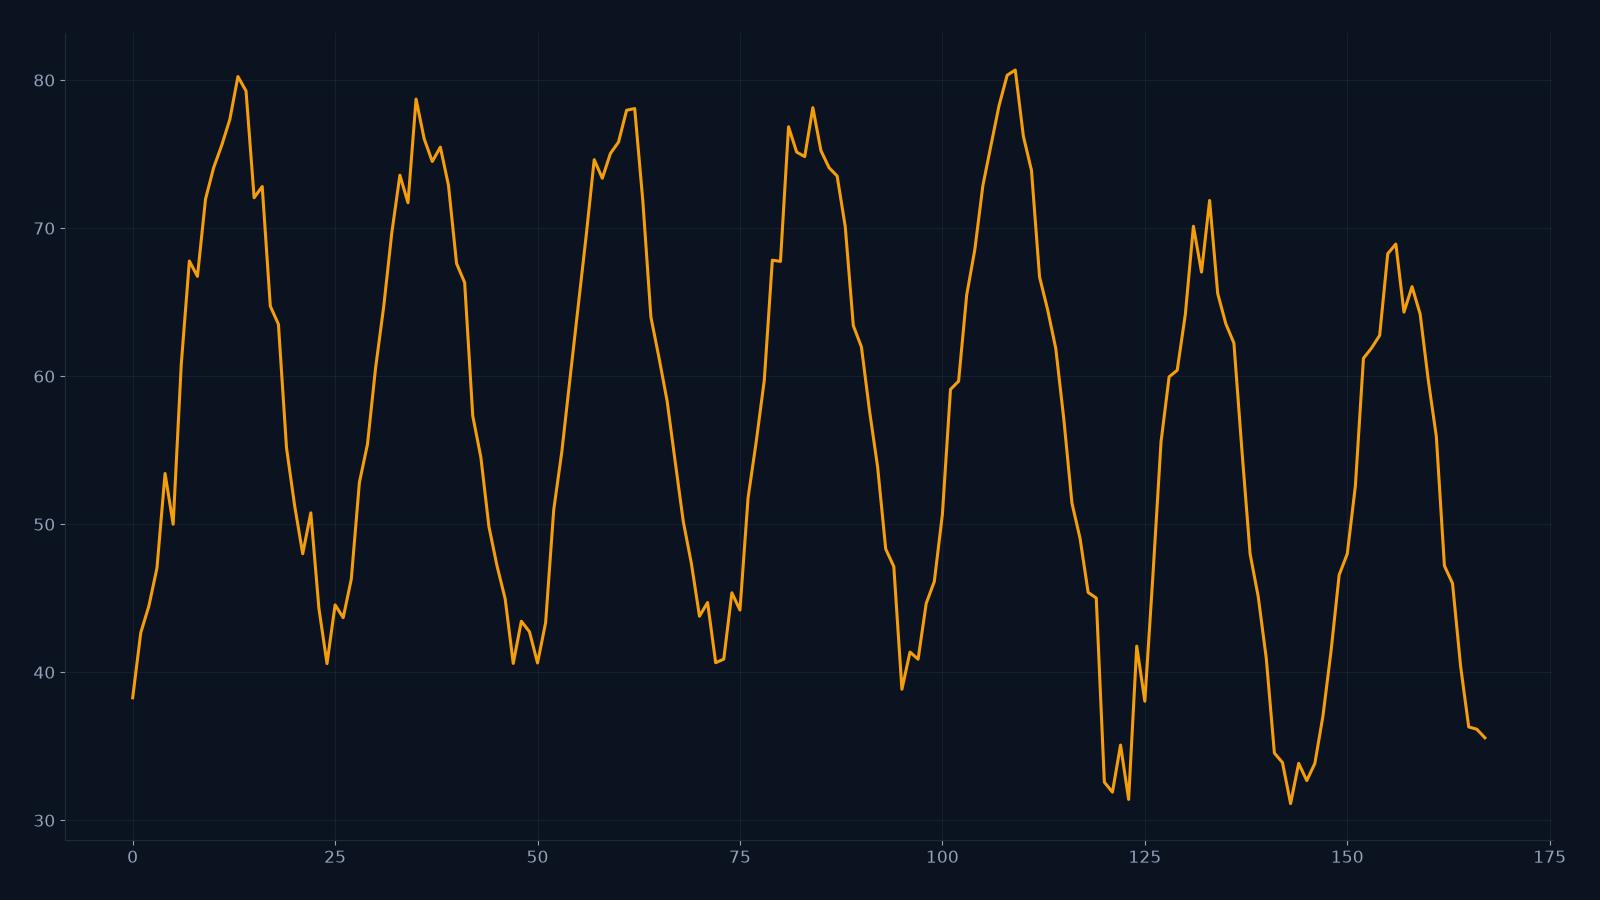
Forecasting is only worth doing when a decision changes because of it. A prettier chart is not a business outcome. This guide covers six use cases where a probabilistic forecast changes a real decision, the data you need, and the metric that tells you whether it worked.
CSV forecast studio
Paste a series, get a probabilistic forecast.
One value per row, or a date column plus one or more numeric columns. Timestral returns a median forecast and a likely range. The demo runs on the public Hugging Face Space; the API is the paid product.
1. Demand and inventory
Decision: how much to order, where to hold it, and when to reorder.
Data: daily or weekly units sold, promotions, price, holidays, stockouts (important: a zero because you ran out is not the same as a zero because nobody wanted it).
Forecast: units per SKU per location, with an 80–95% upper bound for safety stock.
Metric: service level (the share of demand met from stock) and inventory turns. A forecast that improves MAE but increases stockouts is not an improvement.
Watch out: stockout censoring. If you only observe sales when the product is in stock, the history underestimates demand. Mark stockout days or model demand separately.
2. Staffing and scheduling
Decision: how many people to schedule, and when to add on-call capacity.
Data: arrivals or workload per 15/30/60 minutes, day of week, holidays, weather, marketing campaigns.
Forecast: workload per interval, with an upper quantile for on-call.
Metric: wait time, abandonment rate, overtime cost, and the share of intervals where staffing was below the forecast lower bound.
Watch out: a schedule is committed days in advance. A forecast that is accurate only at the last minute is not useful for scheduling. Evaluate at the lead time you actually use.
3. Energy and capacity
Decision: dispatch, battery charge/discharge, procurement, capacity reservations.
Data: load, temperature, day of week, holidays, production schedules, renewable generation.
Forecast: load per interval, ideally multivariate with temperature.
Metric: cost per MWh, peak shaving, and the number of intervals where the actual exceeded the planning bound.
Watch out: weather is a covariate, not a forecast. You need a weather forecast as an input, not a perfect weather model.
4. SaaS traffic and infrastructure
Decision: capacity, autoscaling policy, on-call, cost budget.
Data: requests, sessions, signups, latency, marketing spend, release calendar.
Forecast: requests per hour or per day, with a band for peak planning.
Metric: the share of peak intervals under-provisioned, infrastructure cost, and p95 latency during peaks.
Watch out: releases and campaigns create step changes. A pure time-series model will lag them; add a release or campaign flag.
5. Manufacturing and predictive maintenance
Decision: maintenance windows, spare-parts stock, production planning.
Data: vibration, temperature, pressure, throughput, maintenance logs, failure events.
Forecast: sensor trends and the probability of leaving a normal band.
Metric: unplanned downtime, false alarms, maintenance cost.
Watch out: failure events are rare. A forecast that is accurate on normal days can still miss the failure. Use the forecast band as one signal, not the only one.
6. Finance and revenue planning
Decision: cash planning, budget allocation, hiring.
Data: revenue, orders, refunds, seasonality, pricing changes, marketing spend.
Forecast: revenue per week or month, with a downside quantile for cash planning.
Metric: forecast error at the planning horizon, and the cost of being below the plan.
Watch out: finance data is often revised. Use the as-of data you would have had at the time, not the latest restated numbers, or the backtest will be optimistic.
A common pattern
Every use case has the same structure:
- A decision with a cost asymmetry.
- A history that contains the pattern.
- A forecast horizon tied to the decision lead time.
- A metric that measures the decision, not the chart.
If you cannot name the decision and the metric, do not start with a model. Start with the decision.
A note on “accuracy”
Accuracy is not the goal. The goal is a better decision. A forecast with a slightly worse MAE can be better if it is calibrated in the tail you care about. Choose the metric that matches the decision.
What to read next
- What is Timestral? — the model family.
- Probabilistic forecasting and the 21 quantiles — reading the band.
- How to evaluate forecasts — metrics and backtesting.
- API pricing — one credit per forecast call.
FAQ
Which use case is the easiest to start with?
SaaS traffic or demand, because the data is already digital and the feedback loop is short. Start with one series and one decision.
Do I need a data warehouse?
No. A CSV with a date column and one numeric column is enough to start. The hard part is the decision and the backtest, not the storage.
Can Timestral handle hourly and daily data?
Yes. The model supports long contexts and multiple frequencies; pass one frequency per file.