Timestral-209M Benchmark (2026): MASE, Coverage and Cost on M4
 Charlie Simmon
A reproducible benchmark of Timestral-209M on eight public M4 monthly series: mean MASE 0.514, 87.5% mean 80% coverage, 1.15 s median latency and the exact code to rerun it.
A forecast tool should be judged on held-out data, not on a demo chart. This is a small, reproducible benchmark of the public Timestral-209M model on eight monthly series from the M4 competition. The code, the input subset and the raw results are published with it, so you can rerun the test or swap in your own series.
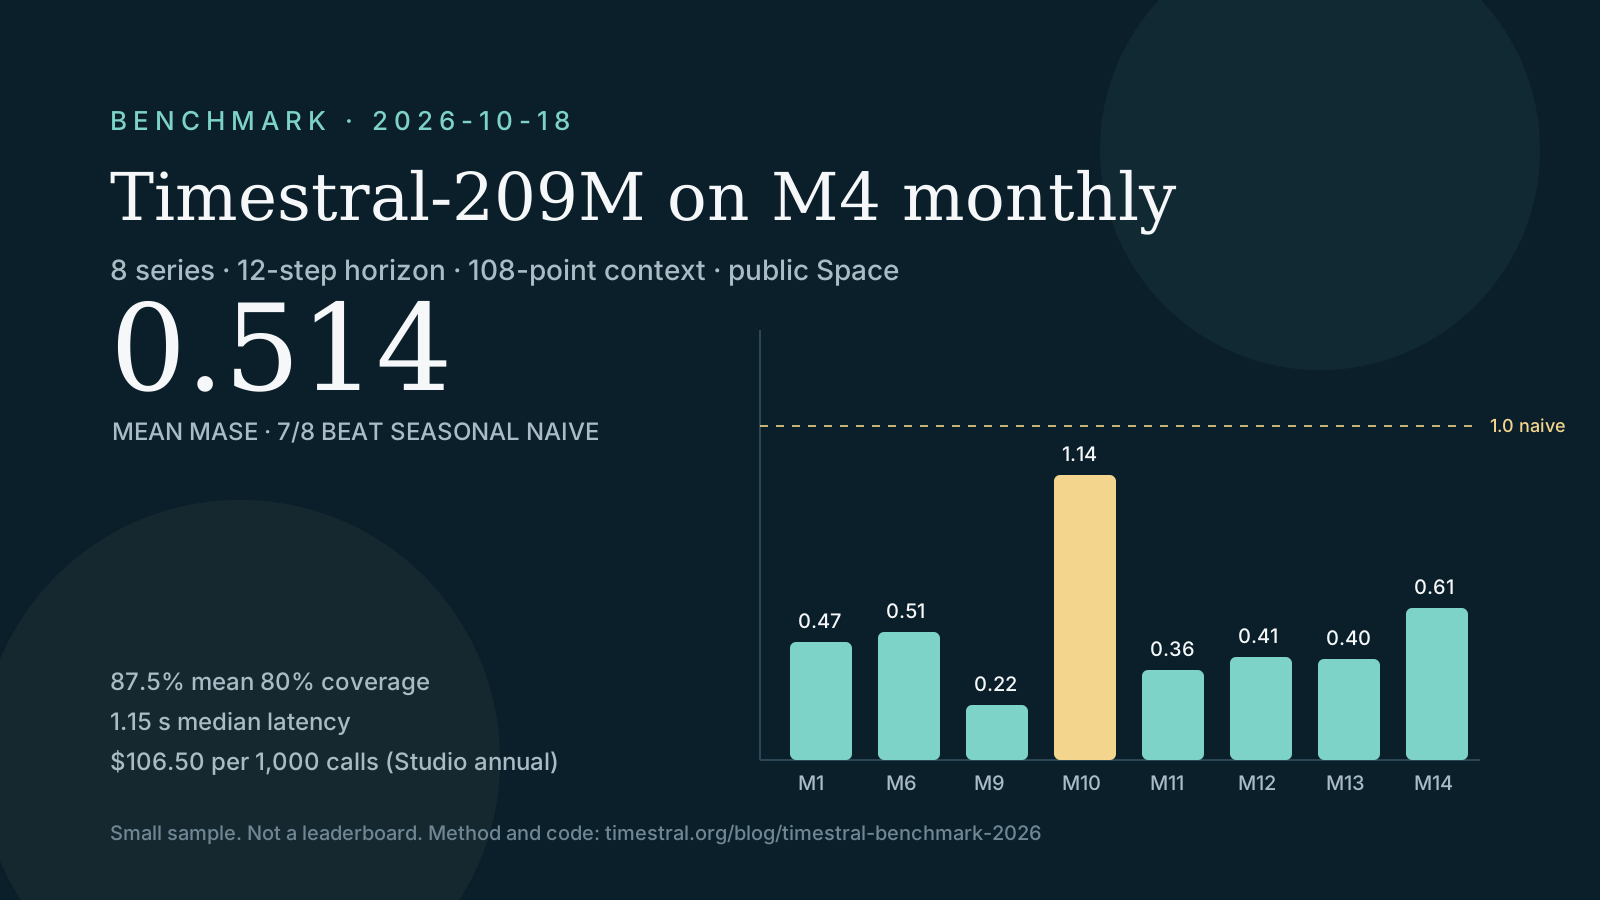
The short version: mean MASE 0.514, median MASE 0.441, mean 80% coverage 87.5%, 7 of 8 series beat a seasonal naive baseline, median latency 1.15 s, and $106.50 per 1,000 calls at the lowest self-serve annual tier. One series failed both the error and the coverage test, which is the most useful part of the result.
What was measured
- Model:
mistralai/Timestral-209M, served by the public Hugging Face Spacemrfakename/timestral-209m. - Data: the last 120 monthly points of eight series from the public M4 monthly dataset. The first 108 points are the context; the last 12 are held out.
- Forecast: 12 steps, median and the 80% interval (quantiles 0.1 and 0.9).
- Metrics:
- MASE — mean absolute error divided by the in-sample seasonal naive MAE (period 12). Below 1 means the model beats the naive baseline.
- RMSE — root mean squared error in the series' own unit.
- 80% coverage — the share of held-out actuals inside the returned low/high band.
- Latency — wall time around one model call, including the public Space round trip.
Results
| Metric | Value | | ----------------------------- | -------: | | Mean MASE | 0.514 | | Median MASE | 0.441 | | Mean RMSE | 222.03 | | Mean 80% coverage | 87.5% | | Series beating seasonal naive | 7 / 8 | | Median latency | 1,153 ms |
| Series | MASE | RMSE | 80% coverage | Latency | | ------ | ----: | -----: | -----------: | -------: | | M1 | 0.471 | 611.14 | 100% | 4,437 ms | | M6 | 0.507 | 341.09 | 92% | 3,113 ms | | M9 | 0.219 | 70.03 | 100% | 1,178 ms | | M10 | 1.139 | 606.10 | 17% | 1,540 ms | | M11 | 0.359 | 62.95 | 100% | 847 ms | | M12 | 0.410 | 28.04 | 92% | 994 ms | | M13 | 0.401 | 31.02 | 100% | 1,128 ms | | M14 | 0.606 | 25.91 | 100% | 900 ms |
The mean coverage is close to the nominal 80%, but the average hides a miss: M10 has 17% coverage and a MASE above 1. The median forecast underperformed the seasonal naive baseline, and the actuals fell outside the band for 10 of the 12 held-out months. A single number in a demo would have hidden that. A backtest does not.
What the numbers mean
MASE below 1 is the useful threshold. It compares the model with a seasonal naive forecast on the same series, so it is scale-free across series with different units. Seven of eight series cleared it. The median MASE of 0.441 means the typical series cut its seasonal-naive error by more than half.
Coverage is a calibration check, not an accuracy score. An 80% interval should contain about 80% of outcomes. The mean is 87.5%, which is close, but the per-series spread is wide: several series are at 100%, and one is at 17%. A 100% interval is not automatically good — it can be too wide to be useful. The M10 miss is the more important signal: on a series the model does not understand, a narrow band is worse than a wide one.
Latency is dominated by the public host. The median call took 1.15 s, with the slowest at 4.4 s. The model itself reported “Took 0.21 s” on the sample call; the rest is the public Space queue and network. A dedicated endpoint would change this number, which is why the benchmark reports the environment rather than claiming a model-only latency.
Cost is the list price, not the GPU bill. One credit is one successful call. At the Studio annual tier, 6,000 credits cost $639, so 1,000 calls cost $106.50. The entry one-time pack is $9.90 for 10 calls, or $990 per 1,000 — the convenience premium is large. The full tier table is in the results file.
Run it yourself
The harness is deliberately small. It reads a long CSV (series_id,date,value), holds out the last 12 points, calls the Space, and scores the result. The core of the scoring code:
// MASE scale: in-sample seasonal naive MAE
let scaleSum = 0;
for (let i = 12; i < train.length; i++) {
  scaleSum += Math.abs(train[i] - train[i - 12]);
}
const scale = scaleSum / (train.length - 12);

// Test error
const mae =
  actual.reduce(
    (sum, value, i) => sum + Math.abs(forecast[i].median - value),
    0
  ) / actual.length;

const mase = mae / scale;
The full script, the M4 subset and the raw JSON are in the public benchmark repository:
- github.com/CharlieLZ/timestral-benchmark — code, data and results.
- Sample input CSV and 21-quantile output — the same files the API reference uses.
To run the benchmark locally:
git clone https://github.com/CharlieLZ/timestral-benchmark
cd timestral-benchmark
npm install
HUGGINGFACE_TOKEN=hf_... node run.mjs
The token is only used to call the public Space; do not commit it.
What this benchmark does not prove
- It is not a leaderboard. Eight series and one horizon are a smoke test. A model that wins here can lose on your data.
- It does not test long horizons. The studio accepts up to 36 steps; the API accepts up to 1,024. This run uses 12.
- It does not test multivariate series. The API supports up to eight related columns; this run uses one series per call.
- It does not measure a dedicated deployment. The public Space is shared and can queue; the latency is not a service-level guarantee.
- It does not establish causality. A low MASE means the pattern matched the holdout, not that a price change or a promotion caused the outcome.
How to use this in a decision
If you are choosing a forecasting tool, run the same harness on your last 12 months. Compare the model with your current plan, not with a vendor's demo. Then ask three questions:
- Is the median better than the naive baseline? If not, the model is not adding value yet.
- Is the 80% band wide enough to cover the outcomes you actually saw? If not, do not use it for a service-level or cash decision.
- Is the cost per 1,000 calls small relative to the decision? A $106.50 per 1,000 forecast is cheap for a production pipeline and expensive for a one-off curiosity.
The M10 result is the reason to do this. A benchmark that only reports the average would have called this a success. The per-series table is where the decisions are.
CSV forecast studio
Paste a series, get a probabilistic forecast.
One value per row, or a date column plus one or more numeric columns. Timestral returns a median forecast and a likely range. The demo runs on the public Hugging Face Space; the API is the paid product.
Reproduce the site claim
The site quotes the mean MASE, coverage, latency and cost from this run. The raw per-series results are in benchmarks/results/latest.json and the table above is generated from it. If a future run changes the numbers, update the table and the date; do not average a new run into an old one.
FAQ
Is Timestral-209M better than Chronos or TimesFM?
This benchmark does not test those models. It tests one model on eight series. A fair comparison would run the same harness on the same data and report per-series results, not a single average. The model comparison guide covers the qualitative differences.
Why is one series above MASE 1?
M10 is a series where the seasonal naive baseline happened to match the holdout better than the model's median. That is normal in a small sample. The low coverage (17%) says the interval was also too narrow for that series. The correct response is to inspect the series, not to remove it from the table.
Does the public Space affect accuracy?
No. It affects latency and availability, not the forecast values. The same model weights produce the same output for the same input (subject to any nondeterminism in the host).
Can I use this benchmark in a sales deck?
Use it with the sample size and the M10 caveat. “Mean MASE 0.514 on eight M4 monthly series, 12-step horizon” is honest. “State-of-the-art accuracy” is not supported by this run.
What to read next
- How to evaluate forecasts — the metrics in more detail.
- Timestral CSV format — how to prepare your own series.
- Forecasting software comparison — when a CSV tool is enough.
- API reference — put the same forecast behind an endpoint.