Timestral CSV Format: The Exact Input the Model Expects (2026)
 Timestral Team
A practical guide to the CSV shape Timestral accepts: optional date column, numeric series, separators, missing values, row and column limits, and the errors to avoid.
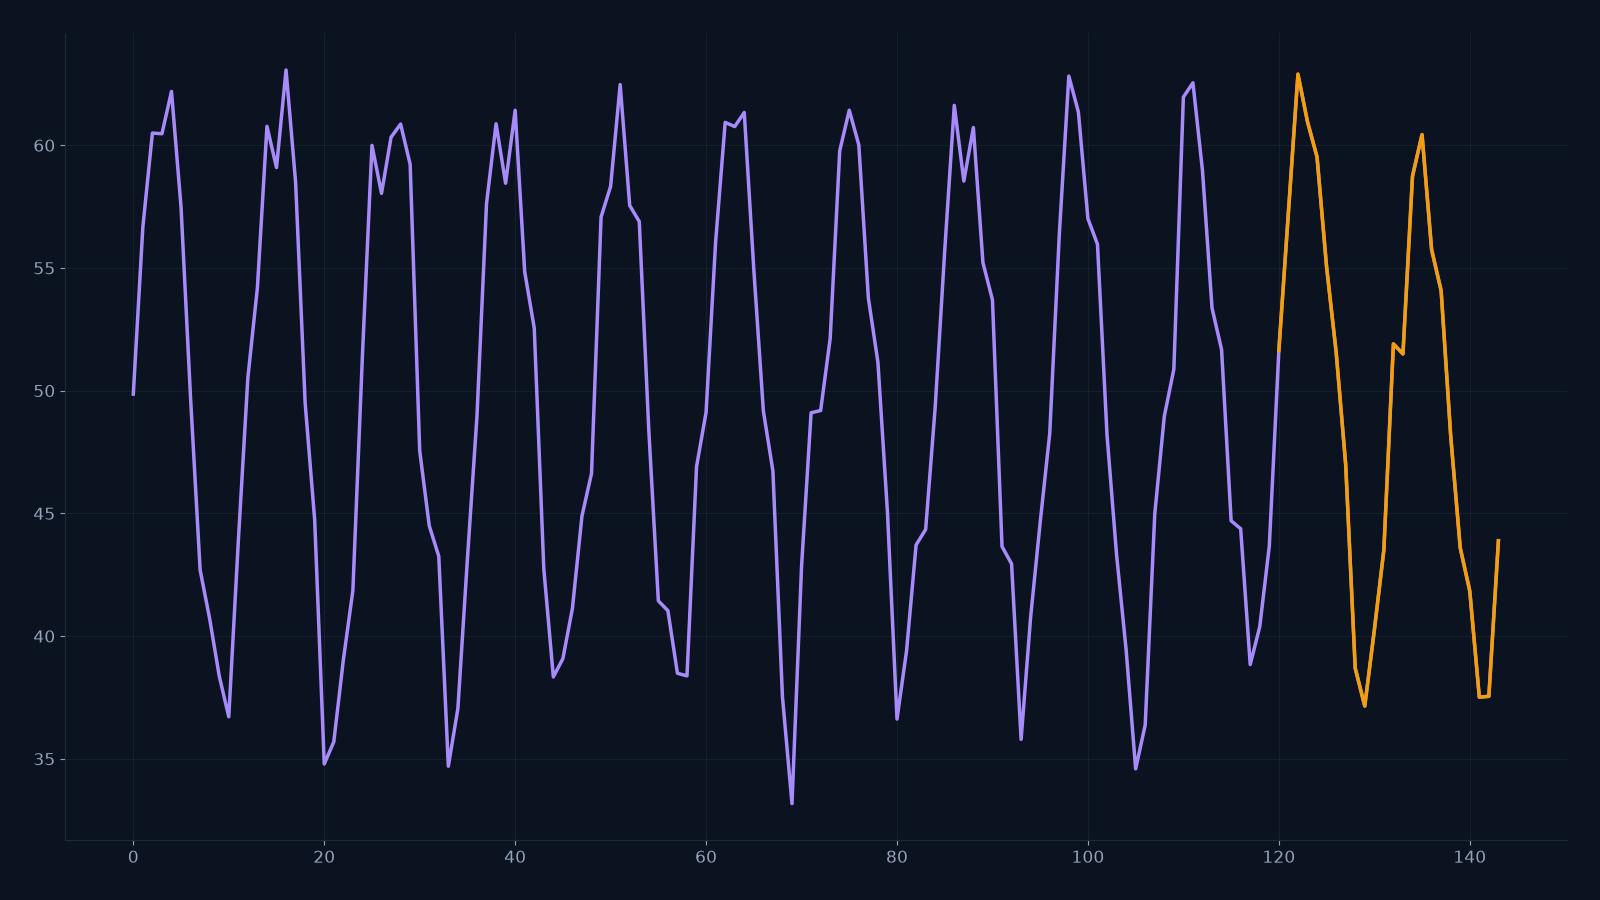
Most failed forecasts are input problems. The model is not psychic: if the date column is a string, the values are percentages, or the rows are sorted backwards, the output will look wrong even when the math is right.
This guide is the exact CSV contract for the Timestral studio and API. It covers the accepted shapes, the limits, the missing-data behavior, and the errors you should fix before spending a credit.
CSV forecast studio
Paste a series, get a probabilistic forecast.
One value per row, or a date column plus one or more numeric columns. Timestral returns a median forecast and a likely range. The demo runs on the public Hugging Face Space; the API is the paid product.
The two accepted shapes
1. A date column plus one or more numeric columns
date,sales
2026-01-01,120
2026-01-02,135
2026-01-03,128
The first column is parsed as a date or timestamp. Everything after it is treated as numeric series. You can have up to 8 numeric columns:
time,load_mw,temperature_c
2026-06-01 00:00,61.2,12.4
2026-06-01 01:00,58.9,11.8
2026-06-01 02:00,57.1,11.2
2. Values only
120
135
128
If the first row looks numeric, the parser reads the file without a header. A single column is treated as one series. This is the fastest way to test a vector, but you lose the timestamps in the output: the forecast index becomes step instead of a date.
Separators
Comma, tab and semicolon are accepted. The parser looks at the first line and picks the first separator it finds. If your file uses a decimal comma, use a semicolon separator to avoid ambiguity:
date;value
2026-01-01;12,5
2026-01-02;13,1
If the values are quoted, keep the quotes consistent. A mixed file with commas inside unquoted text fields will break the parse.
Dates
The parser uses pandas.to_datetime with errors="coerce". A column is treated as dates when more than 90% of its values parse successfully. Accepted examples:
2026-01-012026-01-01 00:00:0001/01/2026(ambiguous; prefer ISO)2026-01-01T00:00:00Z
If the date column is not recognized, it is treated as a numeric series or dropped. That is the most common cause of a forecast with the wrong x-axis. Prefer ISO 8601 (YYYY-MM-DD or YYYY-MM-DD HH:mm:ss) and keep the timezone consistent.
Frequency and gaps
The model does not require a perfectly regular frequency, but it infers one from the index. If the timestamps are irregular, the future index falls back to the median step. Missing values are allowed: leave the cell empty or write NaN. The model handles gaps, but a long gap in the recent history reduces the useful context.
If your data has multiple frequencies (for example, daily totals and hourly readings), do not mix them in one file. Forecast the hourly series at hourly resolution, then aggregate the result.
Row and column limits
| Limit | Value | | ----------------------- | -----------: | | Minimum rows | 8 | | Maximum numeric columns | 8 | | Maximum context | 32,768 steps | | Maximum horizon | 1,024 steps | | Upload size (studio) | 2 MB |
The studio UI exposes 1–36 steps to keep the first experience fast. The API accepts longer horizons up to 1,024. If you need a longer horizon, forecast in chunks and feed the median back as history, or use a larger context.
Missing values and zeros
- Empty cells are treated as missing and are tolerated.
NaNis treated as missing.- Zero is a value, not a missing marker. A series of zeros means “zero”, not “no data”. If zero means “no reading”, use an empty cell instead.
- Negative values are allowed. The “keep forecasts at or above 0” setting only clips when the history never goes below zero.
What the model does with multiple columns
Each numeric column is a series. The model forecasts them together, which lets it use shared patterns. The output table includes a column field, so you can separate the series after the forecast.
Do not put two unrelated series in one file just because they have the same row count. A multivariate forecast assumes the series are related at each time step. If they are not, forecast them separately.
A checklist before you run
- [ ] The first column is a date or timestamp, or the file is values only.
- [ ] Every numeric column contains numbers, empty cells, or
NaN. - [ ] Rows are sorted oldest to newest.
- [ ] At least 8 rows.
- [ ] No more than 8 numeric columns.
- [ ] The separator is consistent.
- [ ] The file is under 2 MB for the studio.
- [ ] The horizon is shorter than or equal to the history you have.
Common errors and fixes
| Symptom | Likely cause | Fix |
| ---------------------------- | ------------------------------------------------------------ | -------------------------------------------------------------------- |
| No numeric column found | The first row was parsed as a header but the values are text | Remove the header or convert the values to numbers |
| Forecast x-axis shows step | The date column was not recognized | Use ISO dates and a consistent timezone |
| The forecast is flat | The history is too short or too noisy | Provide more rows; check for a stuck sensor |
| The band is enormous | The series is highly volatile or the horizon is long | Shorten the horizon; add covariates or use a more stable aggregation |
| Give at least 8 values | Too few rows | Provide at least 8 rows |
| At most 8 numeric columns | Too many series | Split the file or forecast the most important columns first |
What to read next
- What is Timestral? — the model family and what it does.
- Probabilistic forecasting and the 21 quantiles — how to read the output.
- Multivariate forecasting and covariates — when to forecast several series together.
- API pricing — one credit per forecast call.
FAQ
Can I upload an Excel file?
Not directly. Export the sheet as CSV (UTF-8) and upload that. The studio accepts .csv, .txt and .tsv.
Can I use a percentage column?
Convert percentages to a consistent numeric scale first (for example, 12.5 rather than 12.5%). A percent sign makes the column text and it will be dropped.
Does the model need a regular frequency?
No, but a regular frequency produces a cleaner future index. Irregular timestamps fall back to the median step.
Can I forecast daily and weekly series in one file?
Only if they share the same timestamps. Otherwise, run two forecasts.