Time-Series Anomaly Detection with Forecast Bands
 Timestral Team
Use a probabilistic forecast as an anomaly detector: how to set thresholds, control false alarms, and separate a real incident from a model that is merely surprised.
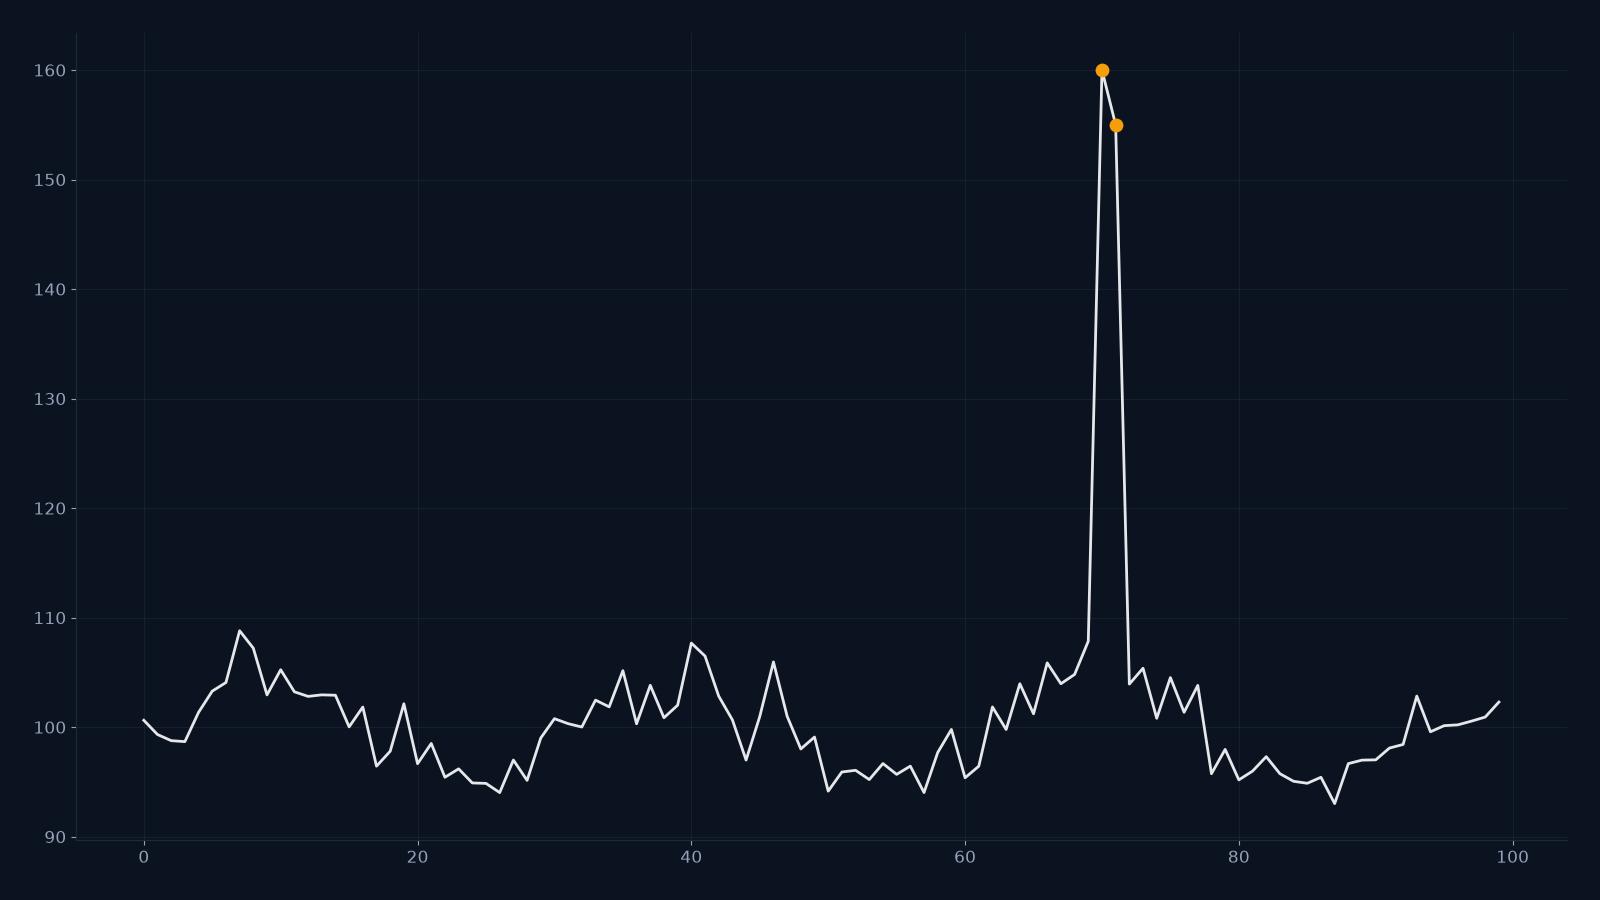
An anomaly is a deviation from what you expected. A forecast band is a formal statement of what you expected. Put them together and you have an anomaly detector that adapts to the series instead of using a fixed threshold.
This guide explains the workflow, the threshold choices, and the failure modes.
CSV forecast studio
Paste a series, get a probabilistic forecast.
One value per row, or a date column plus one or more numeric columns. Timestral returns a median forecast and a likely range. The demo runs on the public Hugging Face Space; the API is the paid product.
The idea
- Forecast the next point or the next window with a probabilistic model.
- When the actual arrives, check whether it falls inside the forecast band.
- If it falls outside the 98% band, flag it for review.
The band widens when the series is uncertain and narrows when it is stable. That is the advantage over a fixed threshold: the same detector works for a quiet series and a volatile one.
Choosing the threshold
- 80% band: many false alarms; useful for early warning, not paging.
- 95% band: a reasonable default for operational alerts.
- 98% or 99% band: fewer alerts, more missed incidents. Use it when the cost of a false page is high.
There is no universal threshold. Measure the false-alarm rate on a backtest and choose the band that matches your on-call capacity.
One-sided vs two-sided
A two-sided band flags both high and low outliers. A one-sided band flags only the direction that matters. For example, a traffic drop may be an incident; a traffic spike may be a launch. Configure the side per metric.
Separate the two questions
An alert answers two different questions:
- Is the actual outside the expected range? (statistical anomaly)
- Does it matter? (business impact)
A forecast band answers the first. It does not answer the second. A 2% deviation on a high-revenue metric may matter more than a 20% deviation on a low-traffic debug endpoint. Combine the statistical flag with a business threshold.
Handling seasonality and holidays
A model that ignores holidays will flag every holiday as an anomaly. Include a holiday or day-of-week covariate, or exclude known holidays from alerting. The same applies to promotions, releases and maintenance windows.
A practical workflow
- Forecast the next window with a 98% band.
- When the actual arrives, compute the deviation and the band.
- If the actual is outside the band, create an alert with the forecast, the actual and the band.
- Group alerts by series and time to avoid a storm.
- Review the alert with a human; label it as a true or false positive.
- Recalibrate the band monthly using the labels.
Failure modes
- Model surprise is not an incident. A structural break makes the model wrong, not the system broken. A wave of alerts after a launch may be expected.
- Missing data looks like an anomaly. A gap in the data can produce a zero or a weird value. Check data freshness before alerting.
- Too many alerts. If every series alerts every day, the detector is useless. Raise the threshold or aggregate.
- Too few alerts. If the detector never fires, it may be too wide. Check coverage on a backtest.
What to read next
- Probabilistic forecasting and the 21 quantiles — reading the band.
- How to evaluate forecasts — coverage and calibration.
- Time-series forecasting use cases — operations examples.
- API pricing — one credit per forecast call.
FAQ
Can Timestral detect anomalies directly?
It produces a forecast distribution. The anomaly flag is a rule you apply to the actual vs the distribution. That is usually more interpretable than a black-box anomaly score.
What band should I use for paging?
Start with 98% and measure the false-alarm rate. If on-call load is too high, raise the threshold or aggregate alerts.
Does the detector need retraining?
No training is required for zero-shot inference, but the band should be recalibrated as the series changes. Re-run the backtest monthly.