How to Evaluate a Time-Series Forecast: Metrics, Backtests and Calibration
 Timestral Team
MAE, RMSE, MASE, sMAPE, interval coverage and backtest design. A practical evaluation checklist for Timestral and any other forecasting model.
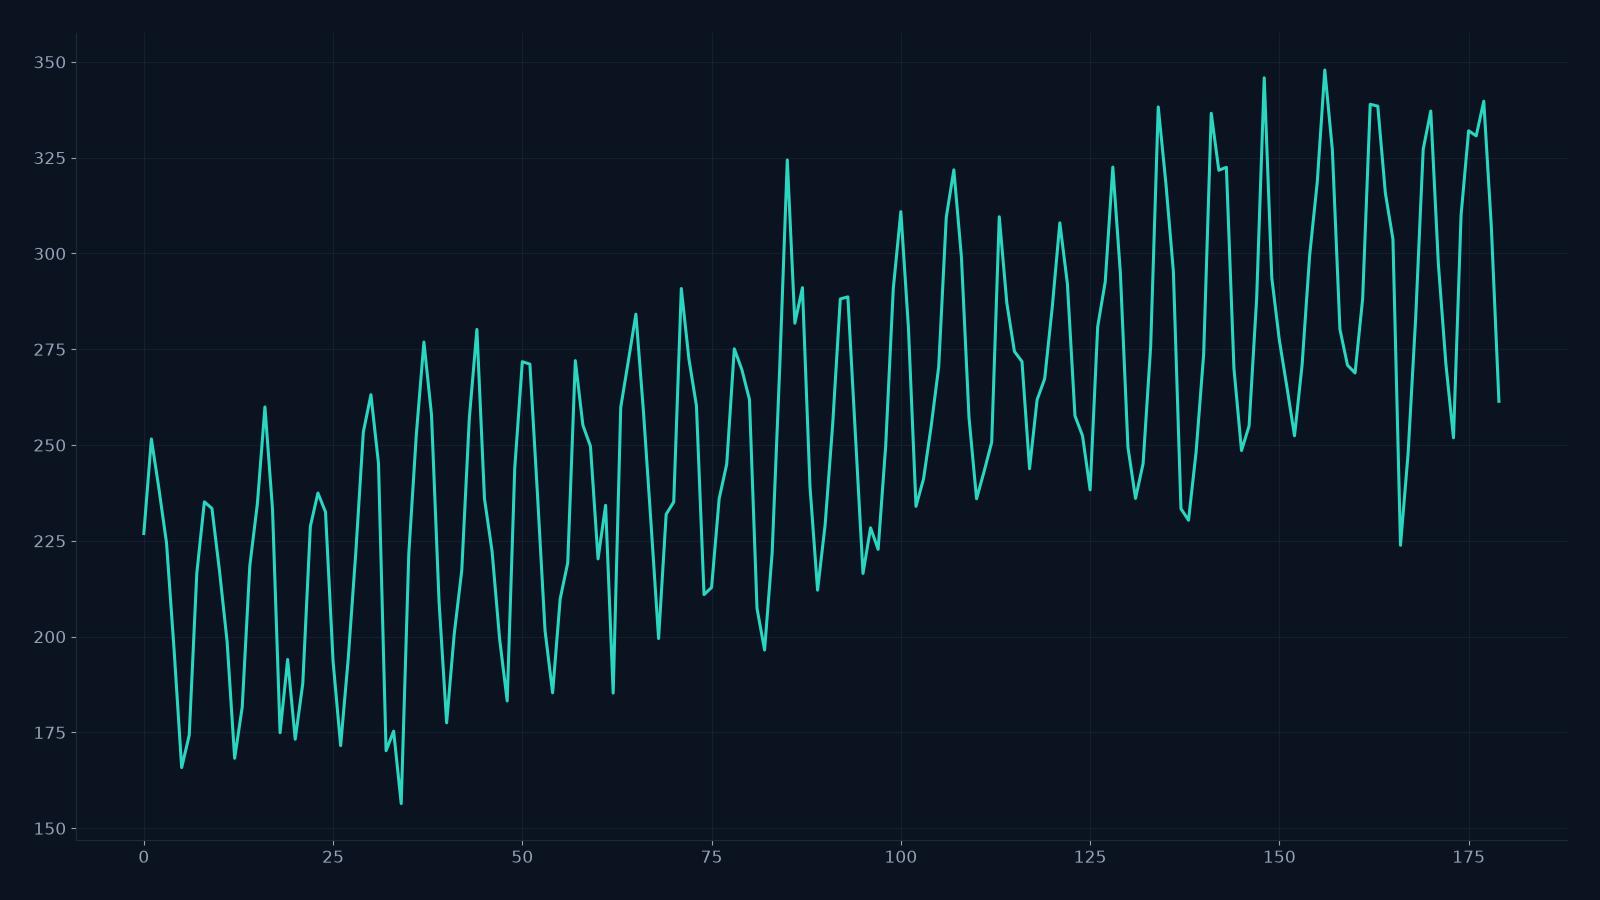
A forecast is a claim about the future. Evaluation is how you decide whether to believe it. The wrong metric can make a bad model look good; the wrong backtest can make a good model look bad.
This guide covers the metrics that matter, the backtest design that avoids leakage, and the calibration checks that are easy to skip.
CSV forecast studio
Paste a series, get a probabilistic forecast.
One value per row, or a date column plus one or more numeric columns. Timestral returns a median forecast and a likely range. The demo runs on the public Hugging Face Space; the API is the paid product.
Point metrics
MAE (mean absolute error)
The average absolute difference between the forecast and the actual. It is in the same units as the series, so it is easy to explain. It treats over- and under-forecasting equally.
RMSE (root mean squared error)
The square root of the average squared error. It penalizes large errors more than MAE. Use it when a big miss is much worse than several small misses.
MAPE (mean absolute percentage error)
The average absolute error divided by the actual. It is easy to explain but breaks when the actual is zero or near zero. Avoid it for intermittent demand.
sMAPE (symmetric MAPE)
A symmetric version of MAPE. It handles zeros better but still has edge cases. It is common in benchmarks; do not use it as the only metric.
MASE (mean absolute scaled error)
The MAE divided by the MAE of a seasonal naive baseline. A MASE below 1 means the model beats seasonal naive. It is scale-free, which makes it useful across series.
Interval metrics
If the model returns quantiles, evaluate the intervals:
- Coverage: the share of actuals inside the 80% band. It should be close to 0.8.
- Interval width: a wider band is easier to cover. Compare coverage at a fixed width, or width at a fixed coverage.
- Pinball loss: the proper scoring rule for quantiles. It rewards sharpness and calibration together. Use it when you need a single number for probabilistic accuracy.
A model that covers 95% of outcomes with an 80% band is over-wide; a model that covers 60% is overconfident. Both are miscalibrated, in different directions.
Backtest design
Rolling origin
Do not train on the future. Use a rolling origin: forecast the next horizon from each cutoff, then roll the cutoff forward. This mirrors production.
Horizon-specific metrics
A model can be good at 1 step and bad at 12. Report metrics per horizon, not only an average.
Multiple series
Average across series, but also look at the distribution. A model that is great on 18 series and terrible on 2 may be a bad production choice if those 2 are your biggest revenue drivers.
No leakage
The most common leak: using a covariate that is only known after the outcome, or using revised data that was not available at the forecast time. Use the as-of data you would have had.
Baseline
Always include a seasonal naive baseline and, if possible, a classical model. A foundation model that does not beat seasonal naive is not automatically an improvement.
A minimal evaluation script
- Split each series into history and holdout.
- For each cutoff, forecast the holdout horizon with each candidate.
- Compute MAE, RMSE, MASE and 80% coverage per horizon.
- Aggregate by series, by horizon and overall.
- Compare latency and cost per 1,000 forecasts.
- Write down the decision rule before you look at the results.
What to do with the result
- If the model beats the baseline on your decision metric and the interval is calibrated, deploy it.
- If the median is good but the interval is wrong, do not use it for risk decisions until you fix the calibration.
- If the model is good on average but bad on your most important series, investigate those series separately.
- If the model is not better than the baseline, keep the baseline and spend the complexity budget elsewhere.
What to read next
- Timestral vs Chronos-2 — a testable comparison.
- Probabilistic forecasting and the 21 quantiles — reading the band.
- Time-series forecasting use cases — linking metrics to decisions.
- API pricing — one credit per forecast call.
FAQ
Which metric should I use?
Use MASE or MAE for the median, and pinball loss or coverage for the interval. Choose the metric that matches the cost of being wrong.
How many backtest windows do I need?
At least 20 rolling windows per series, or enough to cover a full seasonal cycle. More is better for the tail.
Can I compare models with different horizons?
Yes, but report metrics per horizon. A model that wins at 1 step may lose at 12.
Is a lower MAE always better?
No. A model with a lower MAE can be worse for a decision if its errors are concentrated in the tail you care about.