Revenue in · a range out
Sales forecasting from a CSV
Upload monthly revenue and get a 12-month plan with a range, not a single line. Timestral returns the median, an 80% band and all 21 quantiles, so the downside is visible before you commit.
Free browser demo · no account required · email the report to yourself
CSV forecast studio
Paste a series, get a probabilistic forecast.
One value per row, or a date column plus one or more numeric columns. Timestral returns a median forecast and a likely range. The demo runs on the public Hugging Face Space; the API is the paid product.
What sales forecasting needs
Sales forecasting is a range, not a promise.
A single revenue number hides the risk that matters to a hiring plan, a cash-flow forecast or an inventory buy. The useful output is a median plus a band wide enough to cover the scenarios you actually need to survive.
Enough history
At least 8 rows, ideally 24 to 36 months. Two full seasonal cycles are more useful than a long, noisy series with a break in the middle.
The real frequency
Monthly, weekly and daily all work, but one file should have one frequency. A monthly total mixed with a weekly row is not a time series.
A range
The 80% band is the planning range. The low bound is the case to protect against; the high bound is the case to have capacity for.
A backtest
Hold out the last 20% of your history, forecast it, and compare the median with what happened. Do that before you trust any model.
The file
One row per month for sales forecasting.
The simplest sales forecast is a date column and a revenue column. If you have regions or product lines, add them as extra numeric columns, up to eight. Keep the dates in one format and remove totals, blank rows and notes.
- Month-end or month-start dates are both fine; be consistent
- Revenue in one currency, without separators or symbols
- At least 8 rows, up to 2 MB
- Up to 8 numeric columns per request
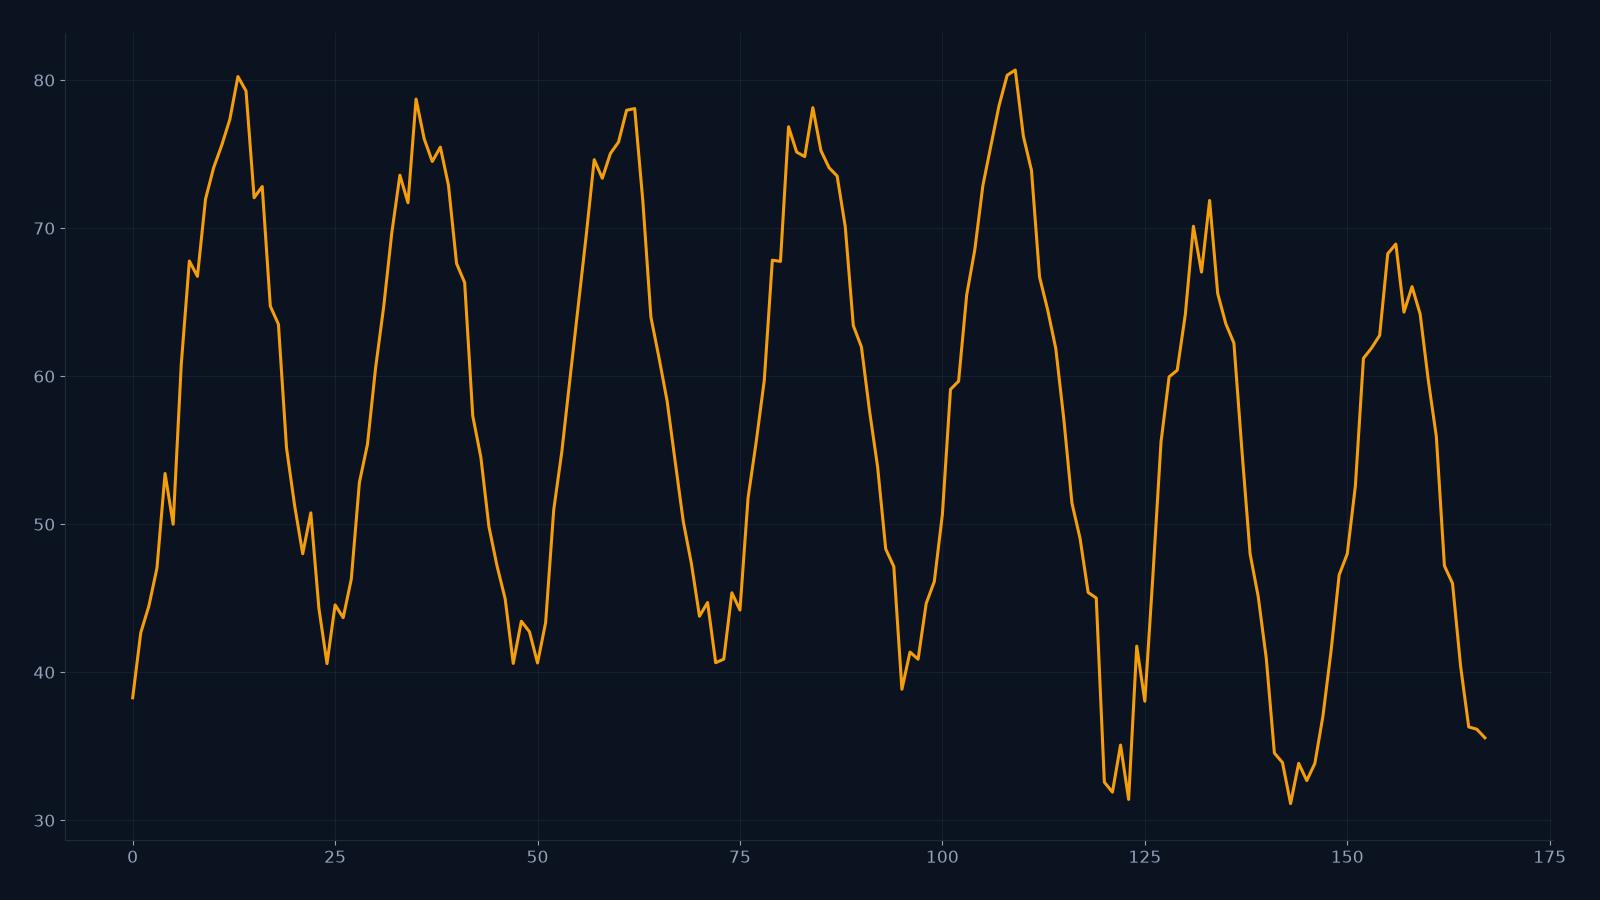
The studio ships a Monthly sales sample with three years of seasonality. Load it, run 12 steps, and you have a worked example before you touch your own file.
month,revenue
2025-01-01,117500
2025-02-01,110300
2025-03-01,101800
2025-04-01,95200
2025-05-01,83000
2025-06-01,83300
2025-07-01,87600
2025-08-01,95100
2025-09-01,109200
2025-10-01,117500
2025-11-01,158800
2025-12-01,166000
If you export from a CRM
Export closed-won revenue by month, not the pipeline. A pipeline forecast and a revenue history answer different questions. If you want to model both, put closed-won in one column and a coverage ratio in another, and treat the second as a covariate rather than a second target.
Reading the result
How to turn a sales forecasting band into a decision.
Median: the plan
Use the median for the revenue target you put in the model. It is the central case, not the best case.
Low bound: the downside
Use the 10th percentile for the cash-flow case you must survive. If the low bound breaks the plan, the plan is too aggressive or the cost base is too high.
High bound: the capacity case
Use the 90th percentile for inventory, support and hiring capacity. The cost of being short is usually higher than the cost of a little slack.
Backtest: the credibility check
Compare the band with realized revenue after the period closes. If actuals land outside the 80% band far more than 20% of the time, recalibrate before you use the tail.
Spreadsheet vs a probabilistic forecast
| Question | Spreadsheet | Timestral |
|---|---|---|
| Setup | Manual growth rate | Upload a CSV |
| Seasonality | Your formula | Learned from history |
| Uncertainty | A few scenarios | 21 quantiles |
| Many series | Copy and paste | Up to 8 columns |
| Repeatable | Manual each month | API call |
A spreadsheet is still the right tool for a one-off plan on a stable series. The case for a model is probabilistic output, many series and a repeatable monthly process.
What sales forecasting does not know.
A zero-shot model learns the patterns in the history you give it. It does not know your pipeline, your sales conversations or the decision you made yesterday. Treat the output as a statistical baseline, not an oracle.
Promotions
A one-off discount is not in the weights. If the history contains similar promotions, add a covariate; otherwise forecast the baseline and adjust the plan outside the model.
Price changes
The model learns correlation, not the causal effect of a price. A price test needs a controlled comparison, not a forecast.
New products
A product with no history has no seasonal pattern to learn. Forecast the category and use a launch curve for the new item, or wait for enough history.
Macro shocks
A structural break, a supply shortage or a new competitor can move the level. The band will widen, but it cannot tell you why. Keep a human override and record the reason.
The honest workflow is: model the baseline, write down the assumptions, adjust for what the model cannot see, and compare the result with the team number. The gap between the two is the most useful part of the exercise.
Before you commit
Backtest sales forecasting on your own history.
Hold out the last 20% of your monthly history. Forecast it with the same horizon you plan to use. Compare the median with a seasonal naive baseline and count how often the actual landed inside the 80% band. If the model does not beat the baseline, use the baseline and keep the complexity budget for something else.
FAQ
Sales forecasting questions.
What history do I need for a sales forecast?
At least 8 monthly rows; 24 to 36 months is better because it contains two or three seasonal cycles. You can forecast weekly or daily sales too, but keep one frequency per file and make sure the history covers at least two full cycles.
Can I forecast sales by region or product?
Yes, up to 8 numeric columns. Put each region or product in its own column with the same date rows. If you have more than 8, forecast the total and the largest contributors separately, or aggregate the long tail.
How do I include a promotion or a price change?
The model is not causal. It will not know the effect of a promotion unless the history contains similar promotions and you give it a covariate that encodes them. For a one-off event, forecast the baseline and adjust the plan outside the model, and record the assumption next to the number.
Is this a replacement for a sales team forecast?
No. It is a statistical baseline. The useful pattern is to compare the model median with the number the team would have committed to, then discuss the gap. The model is consistent and fast; the team knows the pipeline and the customer conversations.
What does a forecast cost?
The browser demo is free while the public Space is available. The API costs one credit per successful forecast; failed calls are refunded. A 10-call one-time pack is $9.90, and the annual Studio plan is $639 for 6,000 calls.
How accurate is it?
There is no universal accuracy number. It depends on the series, the horizon and how much of the future is genuinely predictable. Backtest on a holdout window from your own history and compare the median with a seasonal naive baseline before you rely on it.
Automate the monthly run
The API accepts the same CSV and returns JSON. One credit per successful call; failed calls are refunded. Use it when the monthly plan becomes a recurring job.
Built on the open Timestral-209M model from Mistral AI. The live demo runs on Hugging Face.