Spreadsheet in · forecast out
CSV forecasting
Paste a series or drop a CSV. Timestral returns a chart, a median forecast and a downloadable file with all 21 quantiles. No training run and no GPU.
Works in the browser · no account required · email the result to yourself
CSV forecast studio
Paste a series, get a probabilistic forecast.
One value per row, or a date column plus one or more numeric columns. Timestral returns a median forecast and a likely range. The demo runs on the public Hugging Face Space; the API is the paid product.
The input
CSV forecasting input: a header row and your history.
The first column can be a date or timestamp. Every column after it is treated as a series. A header row is optional, but it makes the output easier to read.
- Commas, tabs or semicolons as the separator
- At least 8 rows of history
- Up to 8 numeric columns
- 2 MB maximum file size
month,passengers
2026-01-01,112
2026-02-01,118
2026-03-01,132
2026-04-01,129
2026-05-01,121
2026-06-01,135
2026-07-01,148
2026-08-01,148
2026-09-01,136
2026-10-01,119
If your CSV came from a spreadsheet
Export as CSV, keep the date column, and remove totals or summary rows. A total row is a number without a timestamp, and it will bend the forecast.
The output
What CSV forecasting returns.
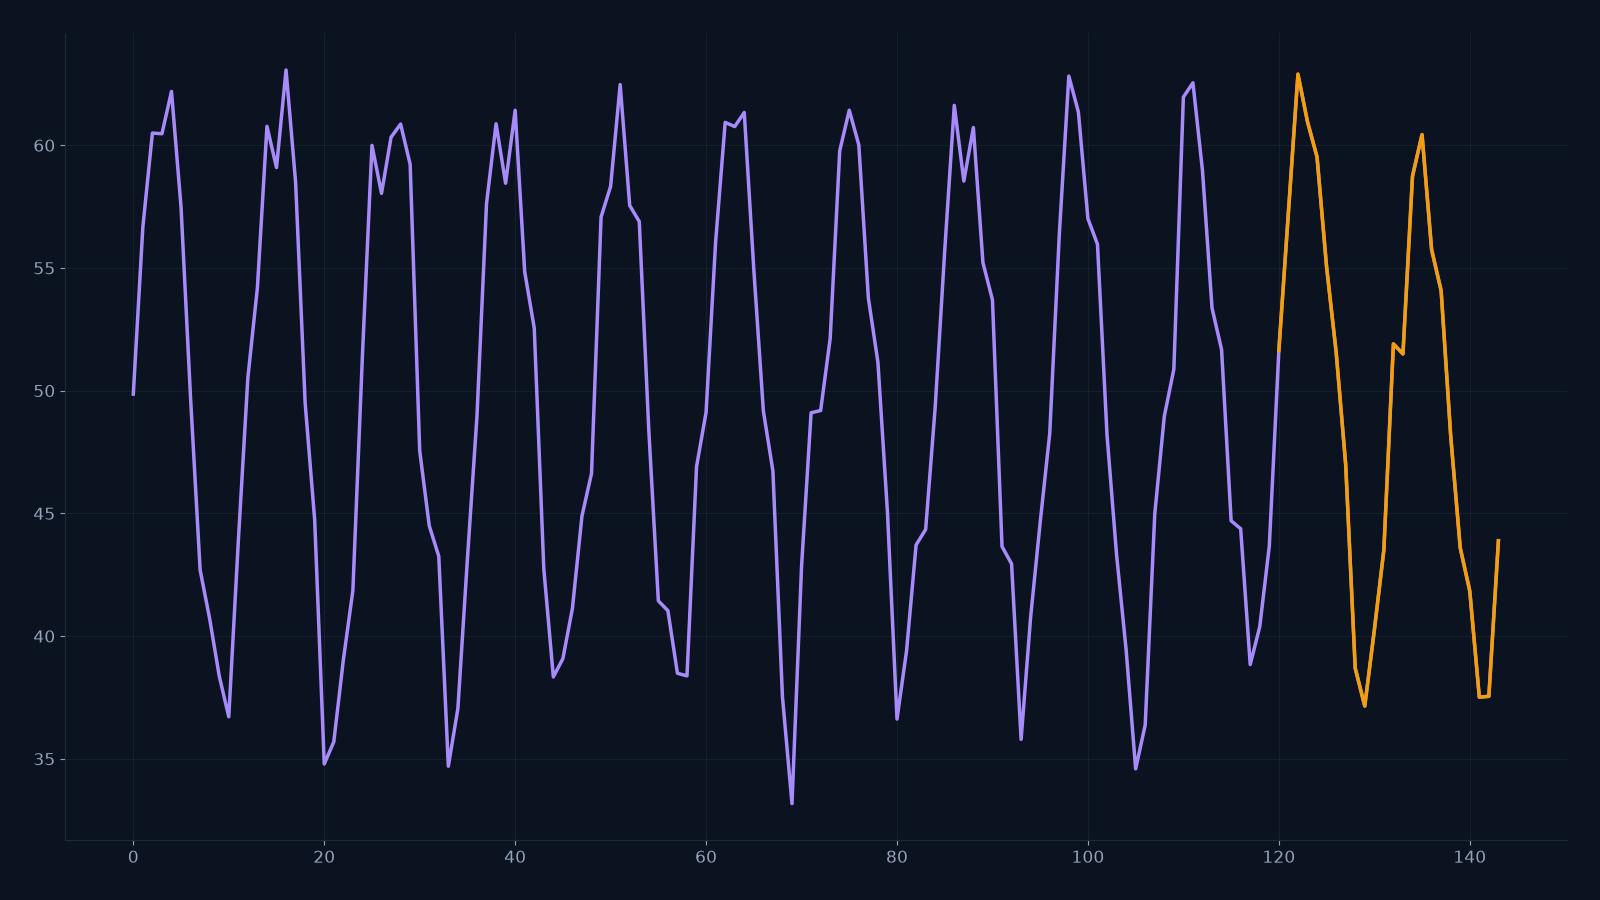
The studio shows the median and the 80% band. The download is a normal CSV, so you can inspect it, chart it, or load it into the tool your team already uses.
Median path
The central forecast for every step in the horizon. Use it when you need one number per period.
21 quantiles
Every row in the downloaded CSV carries the full distribution, not only the 80% band shown in the chart.
A real CSV
Open it in Excel, Sheets, pandas or your warehouse. No proprietary format and no export limit.
Email the report
Send the result to any address without creating an account. Useful when a colleague needs the file, not a login.
What the 21 quantiles mean
Each quantile is a value the model expects the actual to fall below with a given probability. The 0.1 and 0.9 quantiles form the 80% band; 0.5 is the median. Read across a row to see the shape of the risk. A wide gap between 0.1 and 0.9 means the model is less sure, not that the median is wrong.
How to use the band
Use the low bound for the capacity you must not exceed, the high bound for the stock you must have, and the median for the plan. After the period closes, count how many actuals landed inside the 80% band. About 80% should. If far fewer do, add a covariate or recalibrate before you rely on the tail.
Worked example
From ten rows to a twelve-month CSV forecast.
Take the example file above: ten monthly passenger counts, one row per month, one numeric column. Ask for 12 steps and the studio treats each step as one month. The response has a low, median and high value for every month in the horizon.
Read the median as the plan and the band as the risk. If the distance between low and high grows with the horizon, the model is telling you that the future is less certain, not that the forecast is broken. If the band is implausibly wide on a stable series, check the history for a structural break, a mixed date format, or a summary row that entered the series.
Compare the first forecast with the number your team would have used without a model. The useful question is not whether the chart looks plausible; it is whether the median and the downside change a decision about inventory, staffing or spend.
Common CSV mistakes
- Mixed date formats. A column with both 2026-01-01 and 01/02/2026 is not a time index. Normalize it before uploading.
- Totals and subtotals. A total row has no timestamp and describes the other rows. Remove it, or the model will learn a spike that never happened.
- Merged cells and blank rows. Export a flat table. Blank separator rows are read as missing observations.
- One row per product. Put time on rows and series on columns. Ten products with ten rows each is a layout problem, not a multivariate dataset.
- Bounded rates. A percentage can forecast below 0 or above 100. Model the numerator and denominator, or treat the output as a rate to clip, not as a promise.
How it works
CSV forecasting in three steps.
- 1
Paste or upload the CSV
Use your own file or one of the three sample series: airline passengers, website visits or electricity load.
- 2
Pick a horizon
Choose how many steps ahead you need. The studio caps the demo at 36 steps for speed; the API goes to 1,024.
- 3
Download or email the result
The chart and table appear in the browser. Download the quantile CSV, or email it to yourself or a teammate.
When CSV is enough — and when it is not
A CSV is the right interface for an analyst who needs an answer now, a one-off planning cycle, or a quick check before a bigger project. It is the wrong interface for a nightly pipeline that scores thousands of SKUs.
For repeated scoring, use the API. It accepts the same CSV string, charges one credit per successful call, and returns the same quantiles as JSON.
FAQ
CSV forecasting questions.
What CSV format do you accept?
An optional date or time column followed by one or more numeric columns. Commas, tabs and semicolons are accepted. You need at least 8 rows, no more than 8 numeric columns, and the file must be under 2 MB.
Do I need an account to forecast a CSV?
No. The studio on this page runs in your browser against the public Timestral Space. The email report also needs no account. An account is only required for saved history, credits and the API.
What do I get back?
A chart, a table of forecast rows, and a downloadable CSV. Every row contains a low bound, the median and a high bound for the 80% band. The downloadable file contains all 21 quantiles per step.
How far ahead can it forecast?
The studio exposes 1 to 36 steps. The API accepts 1 to 1,024 steps. A step is one unit of your input frequency: 12 steps on monthly data is a 12-month forecast; 24 steps on hourly data is one day.
Can I forecast several columns at once?
Yes, up to 8 numeric columns. A multivariate request can use shared structure between related series, such as load and temperature. Columns that are text or identifiers are ignored as series.
Is my file private?
Your series is used to produce the forecast you requested and is not used to train a model. The browser demo sends the CSV to the public Hugging Face Space. The paid API runs through our own endpoint and stores the result in our bucket.
What if my file has missing values?
Timestral tolerates gaps in many series, but a broken timestamp column or a non-numeric value in a series column will produce a broken forecast. Clean the time index first; it is the most common cause of a bad result.
Next reads
Ready for production?
The API takes the same CSV and returns JSON. Start with a 10-call pack for $9.90, or see the annual plans if you already know the volume.
Built on the open Timestral-209M model from Mistral AI. The browser demo runs on Hugging Face.